The Opacity setting in Discover Pro allows users to adjust the transparency of the chart visualizations directly from the Component ribbon. This feature helps enhance visual clarity and layering by controlling how prominently a chart appears against its background or other overlapping elements.
Setting your Opacity
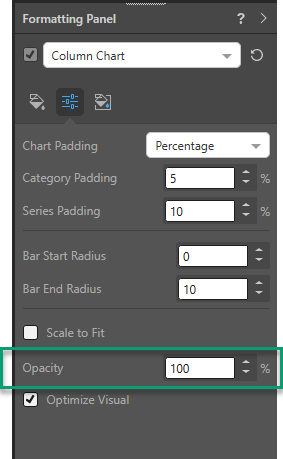
Formatting Panel
The opacity of all charts can be adjusted from the Settings tab in the chart's formatting panel (green highlight below).
Component Ribbon
You can also change the opacity of most charts (not including gauges and maps) directly from the Component ribbon:
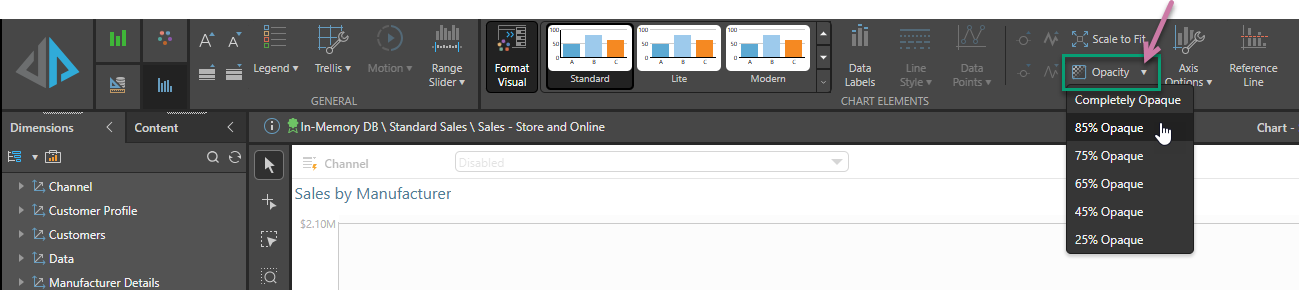
To adjust the opacity, simply change the percentage as required.
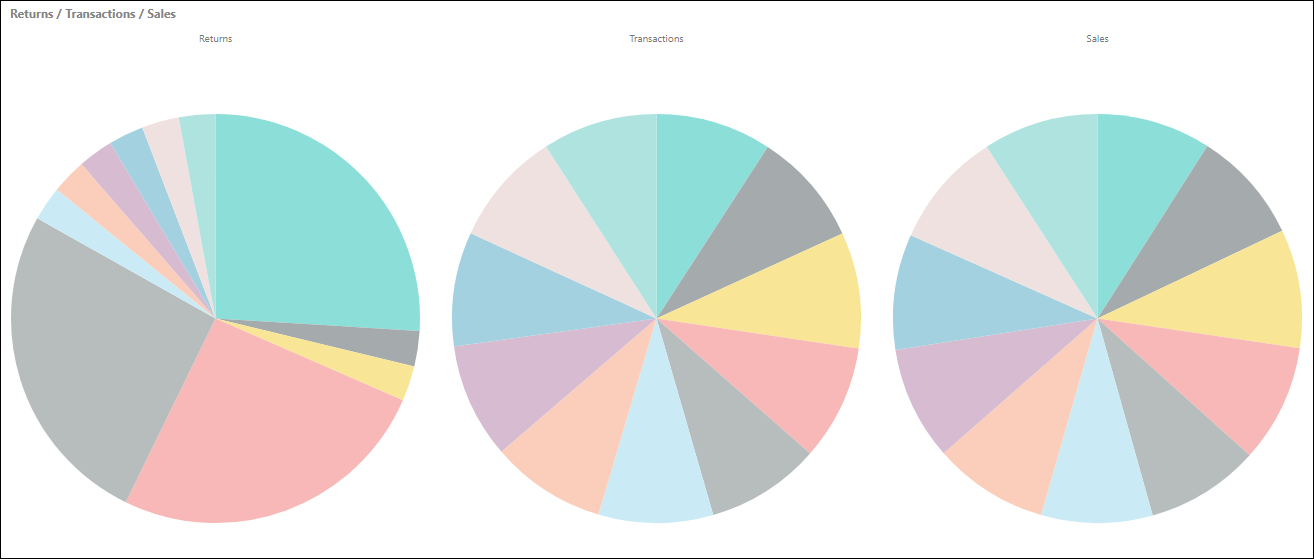
Opacity Example
Here, the opacity was reduced to 45%: